Statistics and Load Development
By Adam MacDonald
Posted on June 06, 2017 at 10:13 AM
This is the first (of hopefully many) guest posts on Bison Ballistics. Today, we get to hear from Adam MacDonald of Autotrickler and Two-Box Chrono fame on the topic of statistics and load development. Be sure to check out his blog at autotrickler.com.
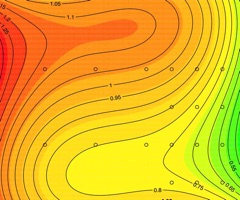
When I read Damon Cali's article on his load development method, I thought it was a very creative approach. A contour plot is a very visual way to find patterns in two variables (powder charge and seating depth). The contour plot clearly identifies the best group, but it doesn't provide much in the way of statistical confidence. Further, the ES of each 5-shot group is a quick way to crunch the numbers for 175 shots, but I thought there must be some additional information buried in there. I was intrigued to analyze the raw data more completely to determine if the result from the contour plot was consistent with a more in-depth approach, and if we could learn some other interesting characteristics of this rifle.
Last week I wrote a blog post called Thinking Statistically, explaining the fundamental concepts of statistics as can be applied to shooting. The next step is to provide the practical tools that shooters can use to better interpret and analyze their performance. Knowing how to interpret results and draw conclusions is critical to settling on the optimal load for your rifle. Processing Damon's test data is a great opportunity to exercise the statistical muscles, to walk through a process with some real-world data.
My working theory of load development is that powder charge primarily affects velocity SD, while seating depth primarily affects group size. This simplification allows for faster load development techniques, but it's important to always question the theory and look for evidence that supports or rejects the theory. Damon carefully fired 175 shots from a quality F-class rifle across a uniform range of powder charges and seating depths, making it ideal, non-biased data for testing the theory.
With no chronograph data, I expected to see no correlation between powder charge and group size, but some relationship to seating depth. The groups range in size from 0.4 to 1.7 MOA, which is quite a large range for a good rifle, so I wasn't sure what to expect. I quickly plotted the ES of each 5-shot group against powder charge and seating depth separately, to see if there was an obvious relationship. This provided these graphs:
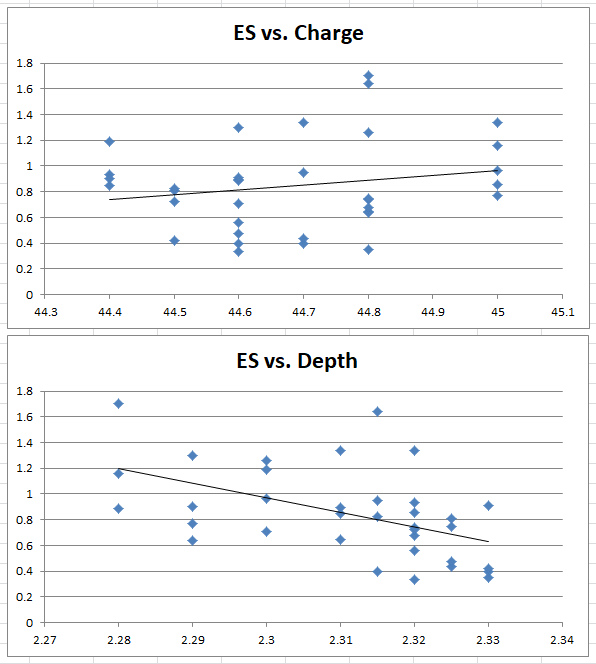
At first glance, it appears to support my theory. It's clear from these scatter plots that there is a lot of variance in the data, and it begs to be analyzed shot-by-shot. There is a trend that greater overall length equals better groups, but it's not enough data to draw any statistical conclusion. With the individual shot data, we might be able to prove this, and look for other insights.
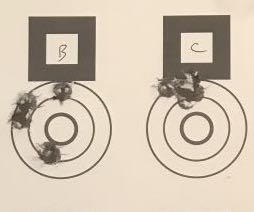
Damon sent me photos of the original targets from two days of testing. I used Photoshop to straighten the photos and print sections of the targets on paper, and then measured the X/Y location of each shot in millimeters relative to a common point.
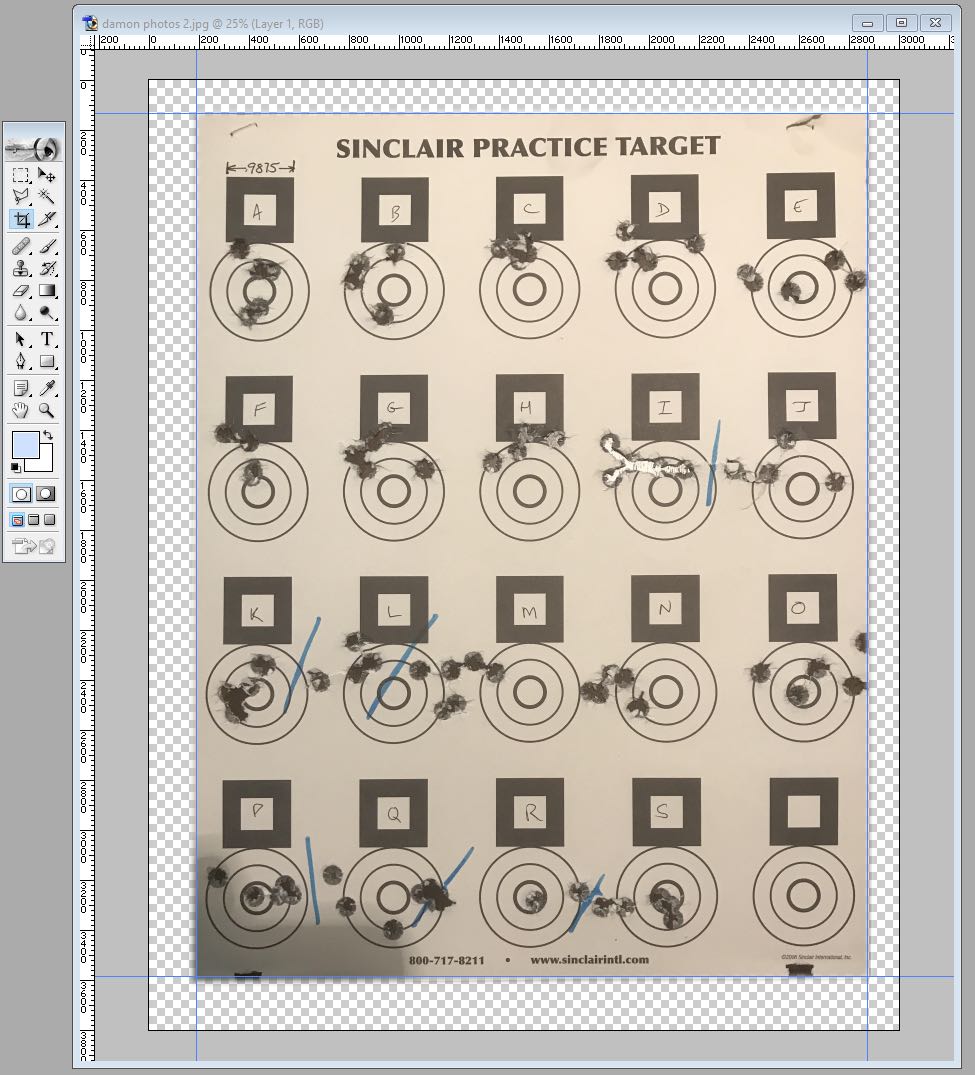
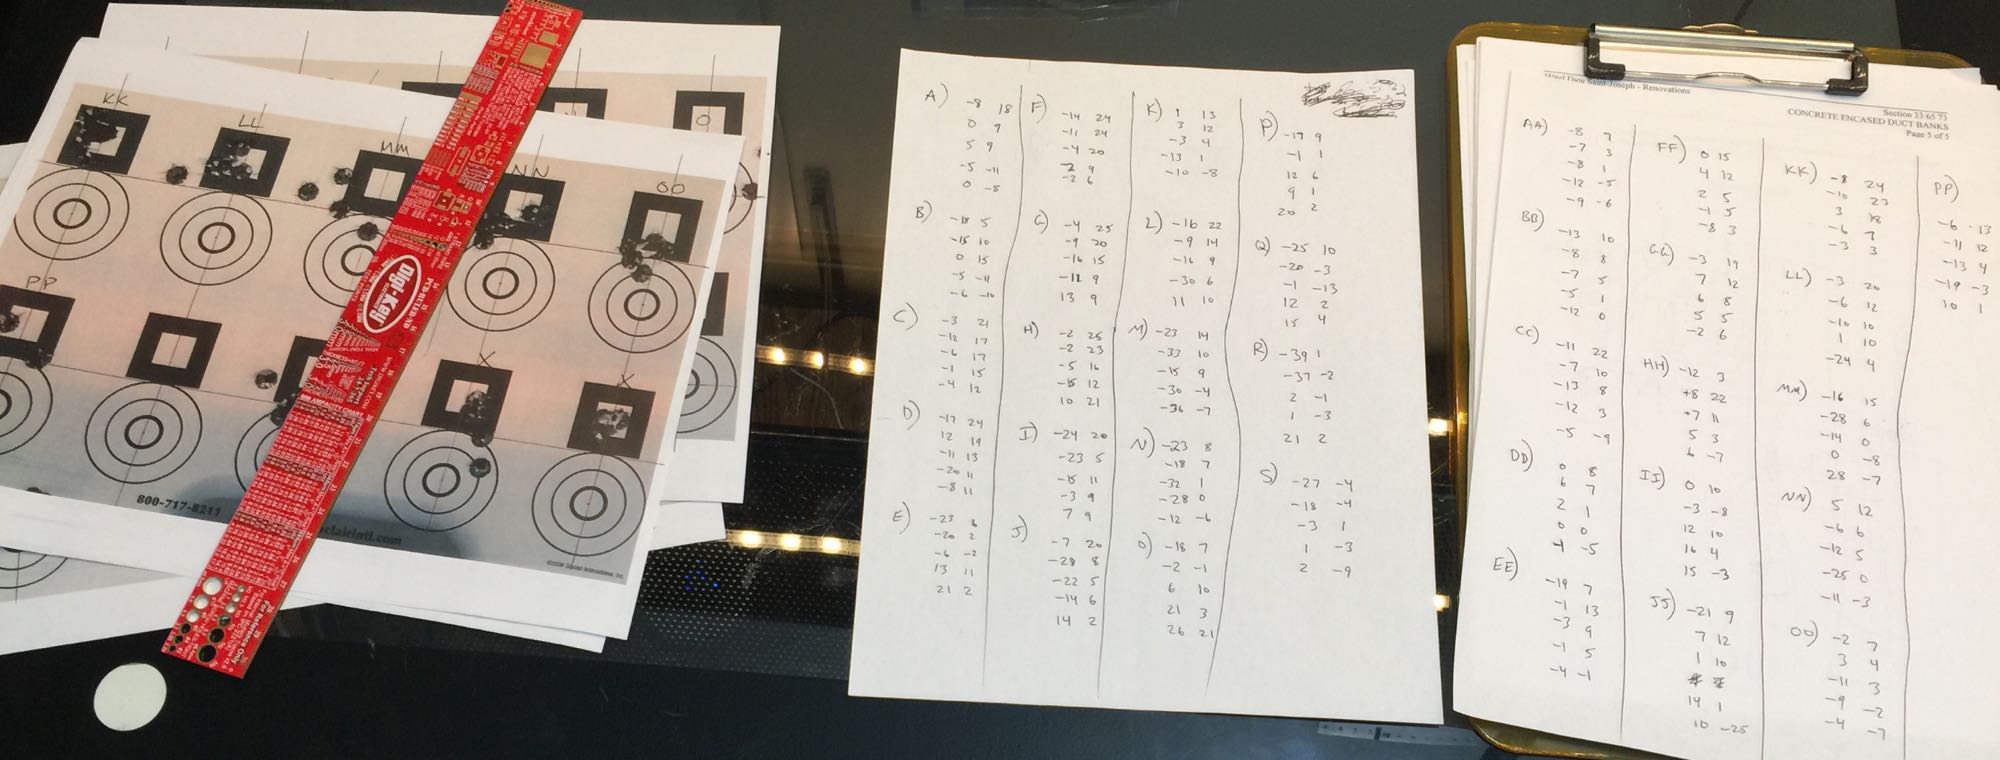
I had a friend check that I made no typing errors, and then plotted each 5-shot group to visually check that I had measured correctly. I found one 10mm measuring error and fixed it. The whole process took about 2 hours.

This data, in millimeters, then needed to be scaled to MOA. Also the aim point between day 1 and day 2 changed, so I centered each day's groups so that they can be compared directly without any scope or wind bias.
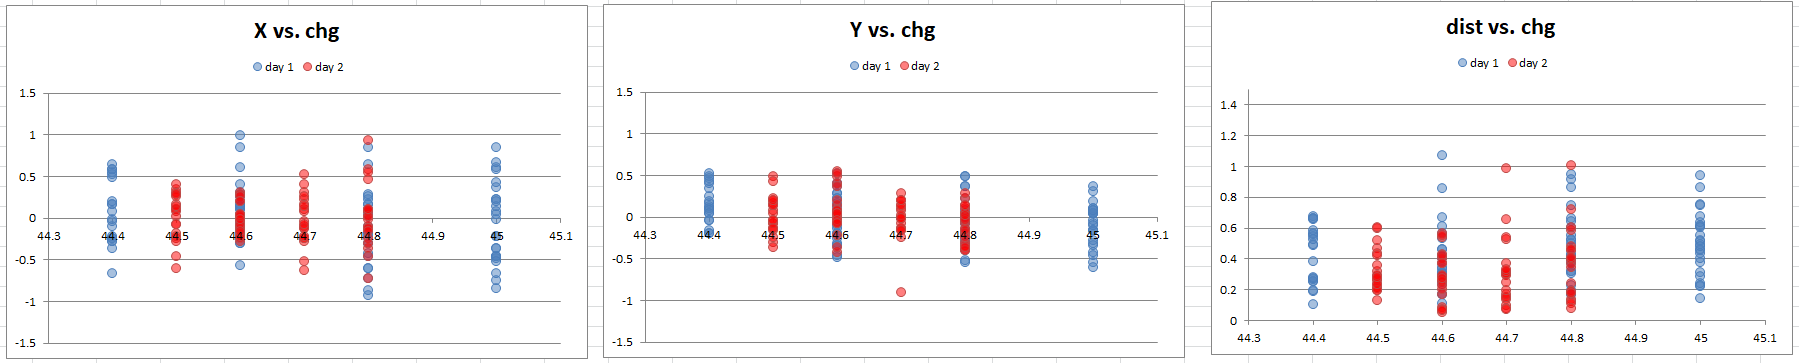
This chart shows which charges and seating depths were tested on day 1 and day 2:

Each point here is a 5-shot group at a specific charge and seating depth. Based on observations from day 1 (blue), Damon chose to focus on a specific area for day 2 (red). Each day has a uniform, but different distribution of a range of charges and depths, and overall, the groups from day 2 were much better than day 1. I would like to combine the data when it helps, but to avoid misinterpreting the trends I chose to display day 1 and day 2 in separate colors.
The first step in analyzing raw data is to look at it. As with the original ES data, we first need some perspective on what the obvious patterns are, and then can focus on specific questions to ask.
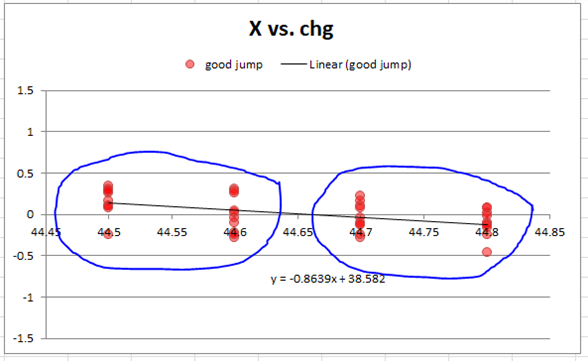
First I plotted X, Y, and distance from center against powder charge:
I am looking for two things. First, a trend in the data upwards or downwards indicates that point of impact shift. There appears to be no such relationship here.
Second, an area of less variation would indicate a smaller group. Specifically at 44.7 there is a tighter spread in Y, however there is also a low flier, and large groups again on either side. Remember this data is spread across all seating depths tested, so unless a trend is totally obvious it's not worth pursuing at this point.
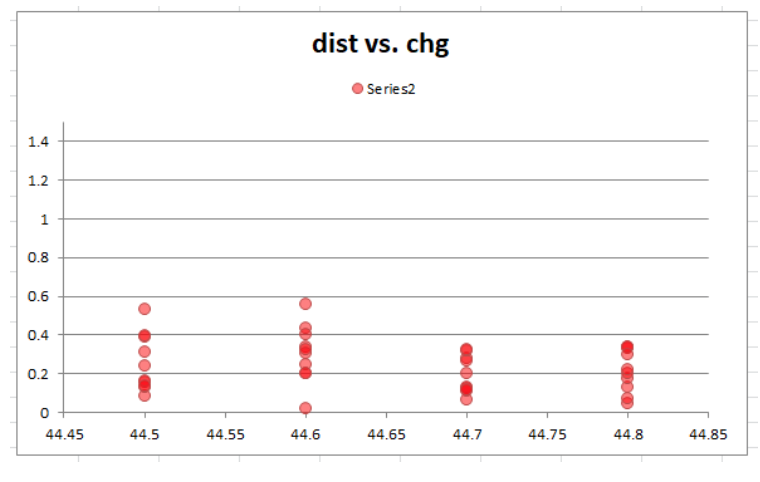
Next I plotted those same metrics against overall length:
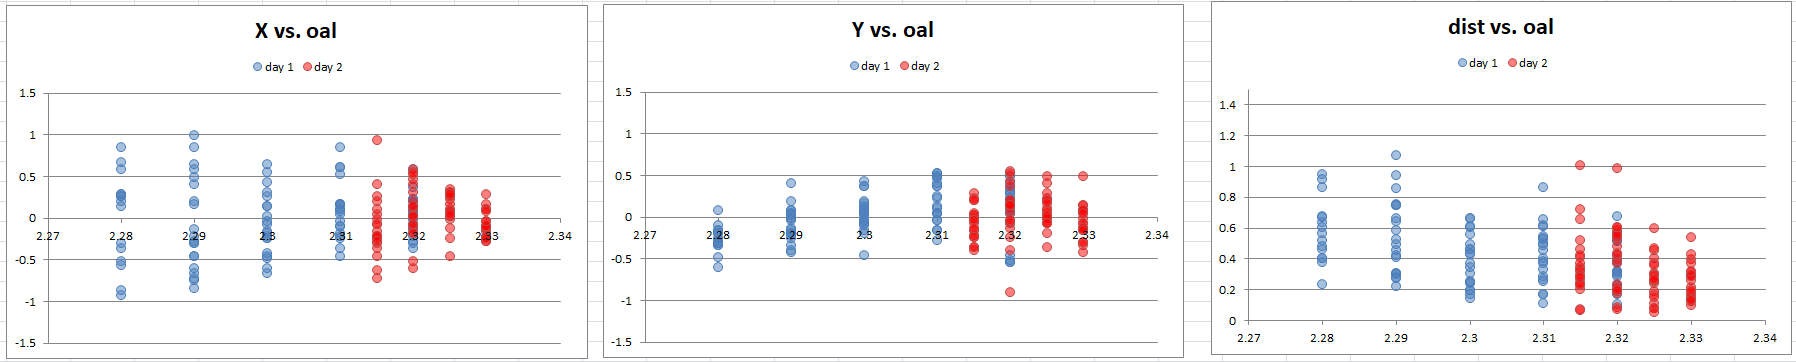
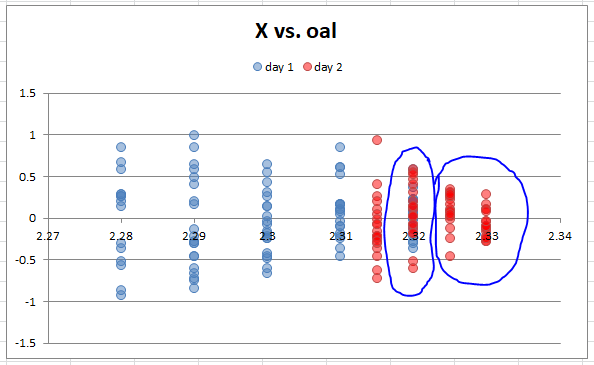
Now this is incredibly interesting. The X coordinates become more consistent at the greater overall lengths. The groups are nearly 2 MOA with more jump, and almost ½ MOA near the lands. Now we have something to focus on, and determine if this result is statistically confident.
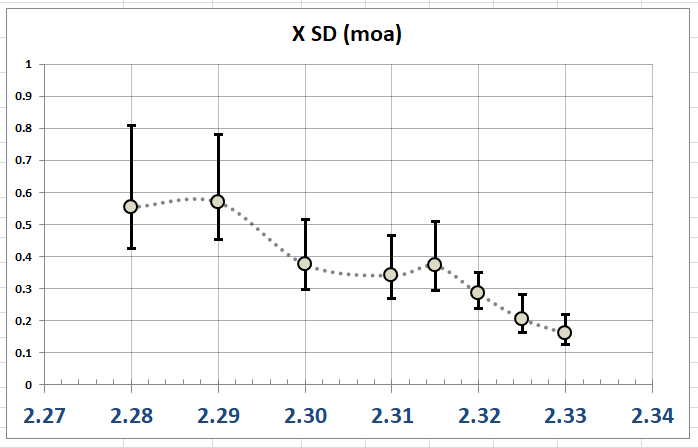 This plot shows the variation in X at each overall length, as an SD with a 90% confidence interval. From this plot it is even more clear that there is a strong relationship.
This is nice to know, but to statistically test a theory, I need to ask a specific question. I need to select two groups of shots, ensuring that there are enough shots in each sample to be meaningful. In this case, I selected the 40 shots at 2.320 and 40 shots from 2.325-2.330, to be compared to see if they have significantly different variation.
If I can show statistical confidence that these groups are different, then it is likely that the result is real, not random chance, and loading to this OAL would consistently produce groups with less horizontal variation. To run this calculation, I use the F-test, which compares the SD of two samples and determines the chance that they are from different populations.
In this case, the statistical confidence is 98%. That's enough to be very sure that we have learned something concrete. There is only a 2% chance that this would happen out of random chance.
Now with the ideal OAL figured out, with statistics to back it up, it's time to look for other patterns. The problem is, now only 40 shots are useful, because the error at other overall lengths would obscure any pattern. In other words, I can only tell if a specific powder charge is "good" if I look at the data at this OAL, because we already know the other OAL's are not good.
This shows the value of iterative load development. Find the most obvious pattern you can, as quickly as you can, and then move forward from there, minimizing wasted shots. The challenge is to know how many shots and what parameters you need to test, in order to take steps in the right direction with statistical confidence. A working procedure for this is a difficult question for another article.
Now isolating the 40 shots at the ideal overall length, I plot the X, Y, and distance against powder charge.
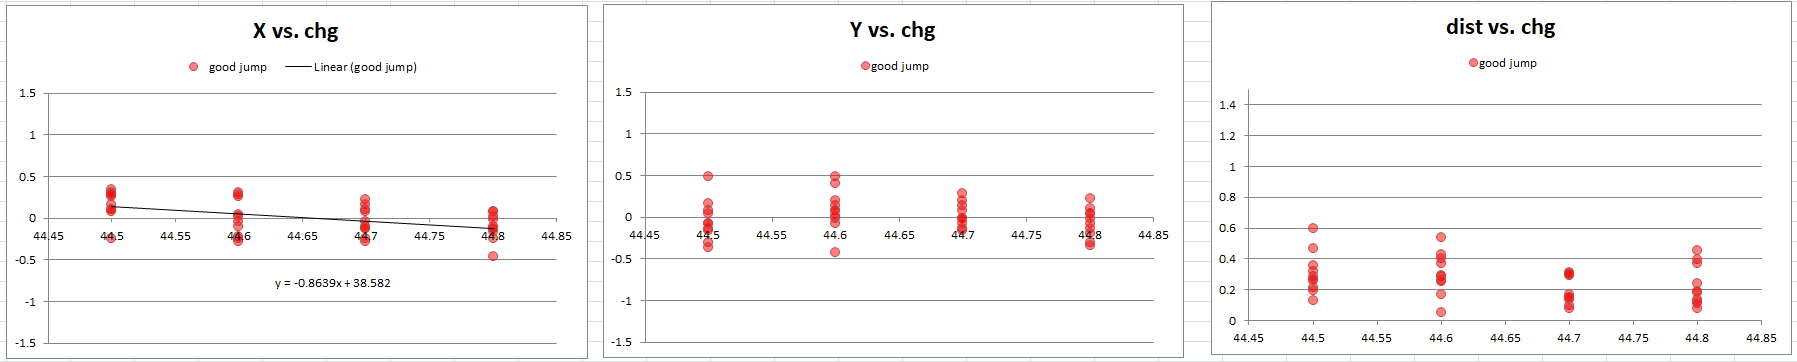
Now we see some interesting results that were not evident from the combined data.
First, there appears to be a trend leftward in X with increasing powder charge. I grouped 20 shots each from the lower and higher powder charges and used the T-test to ask the question: do these two samples have significantly different X centers?
The T-test works by relating the difference in average value to the variation in the data. If the shift in center is large enough relative to the size of the group, then we can be more confident that the POI shift is real and repeatable. In this case, the statistical confidence is 98.7%. This almost proves that POI can be expected to shift by almost ½ MOA simply due to 0.3 grains in powder charge. Personally I doubt this is possible, and I would go straight to the range and test this again to confirm because I almost never see this sort of sensitive relationship with heavy F-class barrels. [Damon: the barrel used was a 32" medium Palma contour - the movement in POI was a head scratcher for me as well.]
Next, look at distance vs. powder charge. It appears that 44.7 was better than either charge around it. This is a scary suggestion, because you really don't want a load that's sensitive to only 0.1 grains. Such a result would be unexpected, since from experience it's not likely 0.1 grains will change your group size that much.

However, I realized something that may be skewing this data. Distance relates the position of each shot to a common center point, however we have just determined that there is a significant X shift across powder charge. So we need to be accounting for that shift. The distance should be taken from a center point of where the group "should be" given the known X-shift.
With corrected distance values, now it is clear that 44.7 and 44.8 are nearly identical, and better than the other charges. Now, instead of possibly concluding that only 44.7 is good, the data is telling us that anything above 44.7 might be just fine. This insight could possible save you from thinking your 44.7 load is accurate but sensitive. In fact it may be at the extreme edge of a much wider range of good performance.
The statistical confidence that 44.7-8 is better than 44.5-6 (using the F-test again) is 88%. That's not as clearly obvious as some other conclusions, so it warrants another day at the range to confirm, but it's still a positive result.
If we look specifically at the "best group", that would be charges 44.7 and 44.8, and overall length 2.325 and 2.330. This combined 20-shot group looks like this:
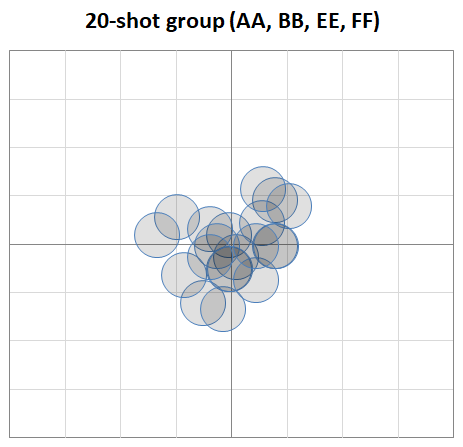
It's a decent group, with an SD of about 0.16 MOA. That means, you can expect 95% of shots to lie within a 0.64 MOA circle, which is approximately the ES of this 20-shot group. With only 20 shots it has a fairly large confidence interval (0.127 to 0.219), so it's hard to know for sure if it's a great load or just a good one. I would definitely go back to the range and focus another 50 shots on testing in and around this powder charge and overall length to get some statistical confidence on expected match performance. Also we can't forget velocity SD, which is much more important to long range accuracy. You would hope that there is a good velocity SD somewhere between 44.7 and the higher limit where groups are similar.
In one of my first blog posts, I ran a similar load development exercise at the range. I am using generally the same components as Damon (185 Juggernauts and Varget) and I found the opposite result - that 20-30 jump was significantly more accurate than near the lands. This shows that you really do need to test and analyze for yourself if you are interested in optimizing your rifle's performance.
I hope this exercise provides some perspective on how statistics can be used to draw conclusions with some test data. I don't suggest everyone go this in-depth with their data collection, but it is a great idea to understand the T-test and F-test and use them to answer specific questions you have about your test results. I will be writing an article soon that will explain these methods and other practical applications of statistics that everyone can take advantage of.
Adam MacDonald is a Canadian F-class shooter and inventor of the Autotrickler and Two-Box Chrono. He brings an analytical perspective to long range shooting with his blog over at autotrickler.com.
The Bison Ballistics Email List
Sign up for occasional email updates.


Want to Support the Site?
If you enjoy the articles, downloads, and calculators on the Bison Ballistics website, you can help support it by using the links below when you shop for shooting gear. If you click one of these links before you buy, we get a small commission while you pay nothing extra. It's a simple way to show your support at no cost to you.


© 2011-2025 Bison Ballistics Munitions, LLC